Overview
The Smart Visualization Tool is an AI-powered module integrated into the BioStrand internal portal. It enables users to analyze and visualize protein structures using natural language commands through a chatbox interface. The tool is designed to support scientific exploration of molecular data without requiring technical or programming expertise.
This functionality is particularly useful for users working with structural biology, protein modeling, and interaction analysis. By leveraging large language models (LLMs), the tool translates plain English input into complex visualization and selection commands, facilitating interactive and targeted structural analysis.
Accessing the tool
To use the Smart Visualization Tool:
-
Log in to the BioStrand Portal. (beta)
-
Navigate to your dataset and open any PDB file.
 Figure 1: Navigating to a dataset and selecting a PDB file (e.g., 6W2C.pdb)
 -
Once opened, a 3D structure viewer is launched. At the top, you will see two input fields:
-
PyMOL Command – for syntax-based queries (advanced users)
-
-
LLM Question – for natural language interaction
 Figure 2: Smart visualization interface within the BioStrand Portal, with input boxes and 3D model viewer
 -
Click the question mark (?) beside either input box to view example commands.
-
Type your question or command in plain English (e.g., “Show ASP98 and highlight residues within 5 Å”) and click Run.
This tool is only available in the beta environment of the BioStrand Portal.
Capabilities
|
Functionality |
Description |
|---|---|
|
Natural Language Input |
Accepts plain English commands to manipulate molecular models. |
|
3D Protein Visualization |
Provides interactive 3D representations (rotate, zoom, pan). |
|
Residue and Atom Selection |
Allows precise selection based on residue type, atom name, proximity, or structural features. |
|
Color Mapping |
Enables visual distinction using color coding based on residue properties (e.g., hydrophobicity, secondary structure). |
|
Labeling |
Supports the addition of labels to selected elements for annotation. |
|
Distance-Based Queries |
Identifies atoms or residues within a defined distance of a specified reference point. |
|
Secondary Structure Analysis |
Highlights α-helices, β-sheets, or loops based on structural context. |
|
Ligand Interaction Assessment |
Enables analysis of residue-ligand proximity |
Basic usage
Once you have successfully opened a PDB file within the Smart Visualization Tool, you can start interacting with the molecular model by entering commands into the designated input field. This intuitive interface allows you to communicate with the tool using natural language or syntax-based queries, depending on your preference and expertise. As you type your commands, the tool's advanced AI algorithms will interpret your input, translating it into precise actions that are applied directly to the molecular model. This process enables you to manipulate the 3D structure in various ways, such as highlighting specific residues, coloring regions based on their properties, or selecting atoms within a certain distance. By leveraging this functionality, you can conduct detailed analyses and gain insights into the molecular structure without needing extensive technical knowledge or programming skills.
Common commands
Show ASP 98
Highlight chain A
Color residues by hydrophobicity
Show all residues within 5 Angstrom of RFY 705
Add labels
Choose atoms named "C", "O", "N", or "CA"
Color blue the polymer within 2.5 of solvent 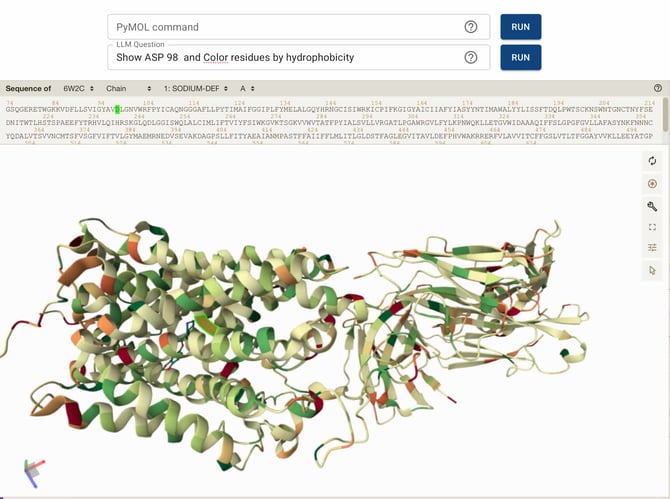
Example scenario
Use case: Structural analysis of Asp98 in SERT (PDB: 6W2C)
This example illustrates a step-by-step analysis of Asp98 within the serotonin transporter to assess its interaction with the ligand I-paroxetine (RFY).
Steps
I would like to show ASP 98
Show all residues within 5 Angstrom of ASP 98 in chain A
Select 705 in purple and add a label
Color residues by hydrophobicity
Color blue the helices residues Objective
These commands collectively help determine the proximity of Asp98 to the ligand, the local hydrophobic/hydrophilic environment, and whether Asp98 is part of a stable secondary structure. This information can be used to hypothesize its potential role in ligand stabilization or protein structural integrity.
Figure 4: Screen recording of this use-case commands execution.
Supported command patterns
Selection commands
|
Command |
Description |
|---|---|
|
|
Selects all hydrophobic residues. |
|
|
Selects all alanines (ALA). |
|
|
Selects common backbone atoms. |
|
|
Spatial residue selection. |
|
|
Selects all helix-forming residues. |
|
|
Selects all residues forming β-sheets. |
Visualization commands
|
Command |
Description |
|---|---|
|
|
Applies a color scale based on residue hydrophobicity. |
|
|
Highlights spatial neighbors of the ligand. |
|
|
Highlights protein regions close to solvent molecules. |
|
|
Adds residue or atom labels to the selection. |
Best practices
-
Use clear, unambiguous language.
-
Specify chain identifiers when necessary (e.g., “Asp98 in chain A”).
-
Combine selection, coloring, and labeling for detailed visualizations.